Hardware Monitor Part 1 — Concept
I'm building a hardware monitoring system in Rust. Not a dashboard that reads "/proc/stat" on one machine — a distributed system where multiple machines report their hardware data to a central receiver, which then serves it to a web frontend in real time.
This is Part 1. No code yet. Just the architecture and the reasoning behind it.
The Problem
I run a Proxmox homelab. Multiple VMs, multiple services, and I want to see what's happening across all of them from one place. Existing tools either do too much (Grafana + Prometheus stack for a homelab?) or too little (htop on each machine via SSH).
I want something lightweight, purpose-built, and — most importantly — something I understand from the ground up because I wrote it.
The Architecture
The system has three roles that all live inside one binary:
- Sender — runs on each machine you want to monitor. Collects hardware data (CPU, RAM, temps, disk) and exposes it when asked.
- Receiver — runs on one machine. Knows about all the senders. When activated, it polls each sender, aggregates the data, and pushes it to the requesting client.
- WebSocket endpoint — the persistent connection between the receiver and the frontend (a Leptos component on spikyprofile.dev).
Every instance also gets a TUI powered by Ratatui — a terminal interface that lets you see what's happening on that node in real time. Whether it's a sender showing its local hardware stats or a receiver showing aggregated data from all senders, you get a live view right in your terminal. No browser needed to check on things. SSH in, see the state, get out.
One binary. You configure it as a sender, a receiver, or both. That's the first design decision and it matters — no juggling different packages or versions across machines.
Here's the full architecture:
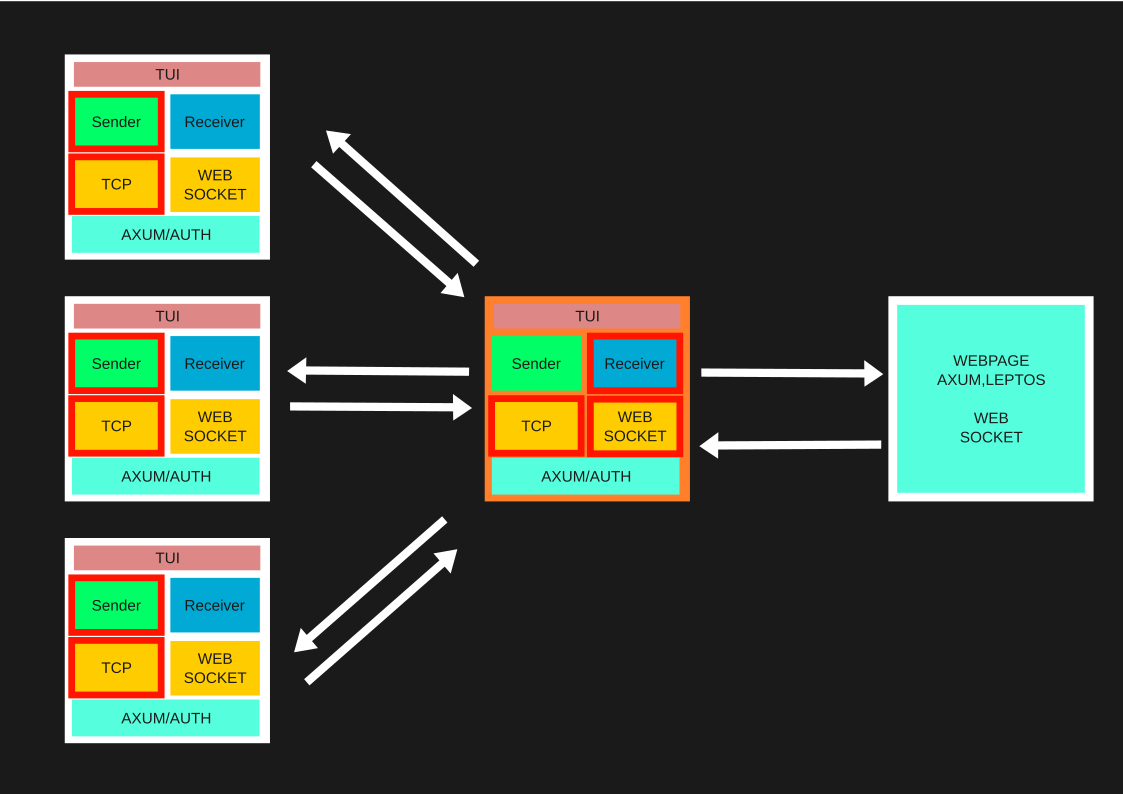
The orange-bordered node is the primary receiver — the hub connected to the webpage. The red-highlighted Sender and TCP blocks show which layers handle outbound data on each node. Every node runs the same binary with the same internal structure: TUI on top, Sender/Receiver logic, TCP/WebSocket transport, and Axum with auth at the base.
The Flow
The website drives the lifecycle. Nothing runs until someone is actually looking at the page. No wasted cycles, no background daemons burning resources when nobody cares.
- The Leptos component mounts → opens a WebSocket to the receiver.
- The receiver begins its polling loop — requesting data from every registered sender.
- Each sender responds with its current hardware snapshot.
- The receiver aggregates everything and pushes it down the WebSocket as JSON.
- This repeats on an interval until...
- The component unmounts (user navigates away or closes the tab) → WebSocket connection drops.
- The receiver detects the closed connection and stops polling. Done.
No explicit stop endpoint needed. The connection is the lifecycle.
Meanwhile, on any node, you can open the Ratatui TUI to see live data locally — independent of the web frontend.
Why This Design?
WebSockets, not REST polling.
The frontend needs continuous data on a short interval. Opening a new HTTP request every few seconds means repeated handshakes, headers, connection setup — all wasted work when both sides already know they're talking to each other. A WebSocket holds that connection open. The receiver pushes data the moment it's ready. And when the user leaves, the dropped connection is the stop signal — clean, automatic, no extra logic.
One binary, multiple roles.
This is a Rust decision. A CLI flag or config file switches behaviour. Compile once, deploy everywhere. The sender on a lightweight VM doesn't need to carry receiver logic (or it can — your call). Deployment is dead simple: scp the binary, write a config, run it.
Senders don't push — they respond.
Senders are passive. They don't need to know where the receiver is or manage any outbound connections. The receiver asks, the sender answers. Adding a new machine to the monitor is just: deploy the binary as a sender, add its address to the receiver's config. No coordination, no discovery protocol, no added complexity.
Ratatui for the terminal interface.
Every node gets a TUI out of the box. This isn't just a nice-to-have — it's how you'll interact with the system 90% of the time. SSH into a machine, fire up the TUI, see live stats. No need to open a browser or hit an API. Ratatui gives us a rich, responsive terminal UI with graphs, tables, and real-time updates — all without leaving the terminal where you're already working.
The Stack
- Axum — HTTP server and WebSocket handling
- Sysinfo — cross-platform hardware data collection
- Ratatui — terminal user interface
- Tokio — async runtime tying it all together
- Leptos — the web frontend that consumes the data (on spikyprofile.dev)
What's Coming in Part 2
The actual implementation. I'll start with the sender — reading hardware data using the sysinfo crate, exposing it over a simple HTTP endpoint with Axum, and wiring up a basic Ratatui display so you can see your own machine's stats in the terminal. That's the smallest useful piece, and it works standalone before we even think about the receiver.
If you want to follow along, you'll need Rust installed and a machine with a pulse (CPU temps count).
This is the first post in the Hardware Monitor series. I'm building this in public as part of Spiky Rust — learning Rust by building real things, explained from the top down.
Author: Patryk Sikorski
Posted: 06/04/2026